XAU/USD Current price: $3,381.27
- Trade and geopolitical tensions sent the US Dollar Index to fresh multi-month lows.
- The University of Michigan will release The Consumer Sentiment index on Friday.
- XAU/USD advances for a second consecutive day and has room to extend the advance.
Fears pushed Gold towards the $3,400 level on Thursday, its highest for the week. Demand for the bright metal surged amid US Dollar’s (USD) sell-off, which dominated financial boards for most of the day.
The Greenback declined on Wednesday after the United States (US) President, Donald Trump, anticipated a trade deal with China was “done,” clarifying it was still subject to Chinese President Xi Jinping’s approval. Additionally, the country released the May Consumer Price Index (CPI), which resulted in softer than anticipated, fueling optimism about the state of the US economy.
The USD kept falling on Thursday amid rising Middle East tensions between Israel and Iran. Israel is preparing an operation against Iran, with the US expecting retaliatory measures, according to sources familiar with the matter. Additionally, nuclear talks between the US and Iran appeared to have halted. Trump used Truth Social to report that an Israeli strike could “very well happen,” adding that he would love to avoid conflict, but also that Iran has to negotiate toughly. He ended his post saying that there’s a chance of a massive conflict in the region.
Trade-war-related headlines added fuel to the fire: Trump said that he was willing to extend the July 8 deadline for completing trade talks, but also added that he is ready to impose unilateral tariffs within two weeks, to multiple trading counterparts.
On Friday, the focus will be on the preliminary estimate of the June University of Michigan’s (UoM) Consumer Sentiment Index. Market players will pay special attention to the one-year and five-year inflation expectations.
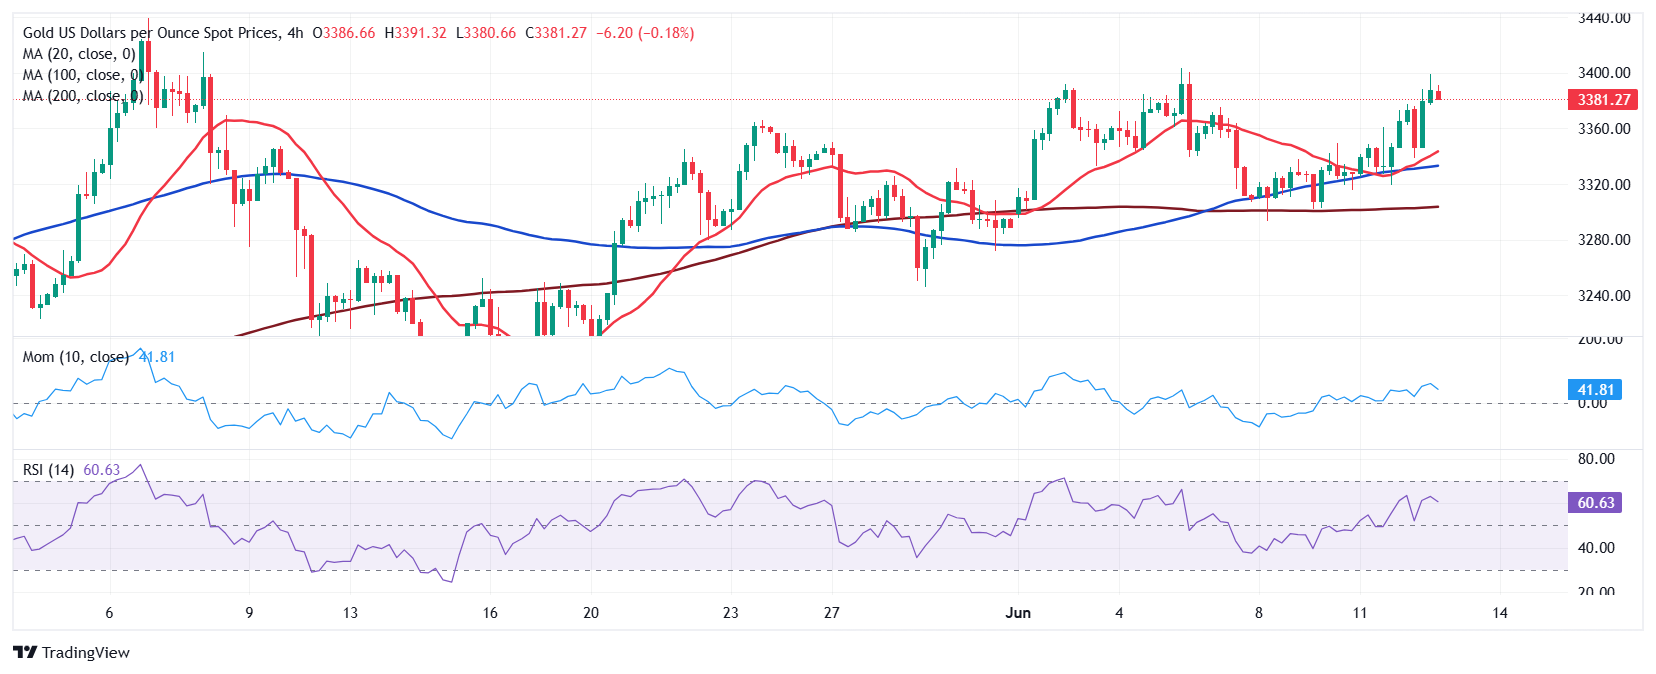
XAU/USD short-term technical outlook
Technically speaking, the XAU/USD pair has room to extend its advance beyond the $3,400 mark, which should lead to a rest of record highs in the near term. The daily chart shows the pair advanced at a moderate pace, with technical indicators aiming marginally higher within positive levels. At the same time, the 20 Simple Moving Average (SMA) gains upward traction above also bullish 100 and 200 SMAs, while providing dynamic support at around $3,318.
In the near term, and according to the 4-hour chart, the XAU/USD pair is losing its bullish momentum. Technical indicators turned lower, easing within positive levels, as a result of the ongoing retracement. Additional losses, however, seem unlikely, given that moving averages extend their upward slopes below the current level, and with the 20 SMA accelerating north above the longer ones.
Support levels: 3,362.40 3,348.35 3,310.00
Resistance levels: 3,402.50 3,414.60 3,437.85