XAU/USD Current price: $3,349.81
- Big miss in the ADP survey hints at a tepid June Nonfarm Payrolls report.
- Financial markets remain cautious amid US political and fiscal jitters.
- XAU/USD gains upward traction in the near term, aiming for $3,373.50.
Gold trades uneventfully in the $3,340/50 price zone on Wednesday, unable to attract speculative interest amid a prevalent cautious mood, partially benefiting the US Dollar (USD) throughout the first half of the day. Concerns arose after United States (US) President Donald Trump’s tax cut bill barely passed the Senate on Tuesday. Concerns revolve around the final destiny of the One Big Beautiful Bill now in the House.
Stocks suffered from speculation that the tax cut wouldn’t come, while discouraging US data added to the dismal sentiment, but also harmed the Greenback during American trading hours. The US ADP Employment Change report showed that the private sector lost 33,000 jobs in June, much worse than the 95,000 additions anticipated. Additionally, the May reading was downwardly revised to 29,000 from the 37,000 previously informed.
Given the 4th of July holiday in the US, the country will publish the June Nonfarm Payroll report on Thursday. The Unemployment Rate is foreseen at 4.3%, up from the 4.2% posted in May. Also, market analysts anticipate the country added 110,000 new jobs in the month.
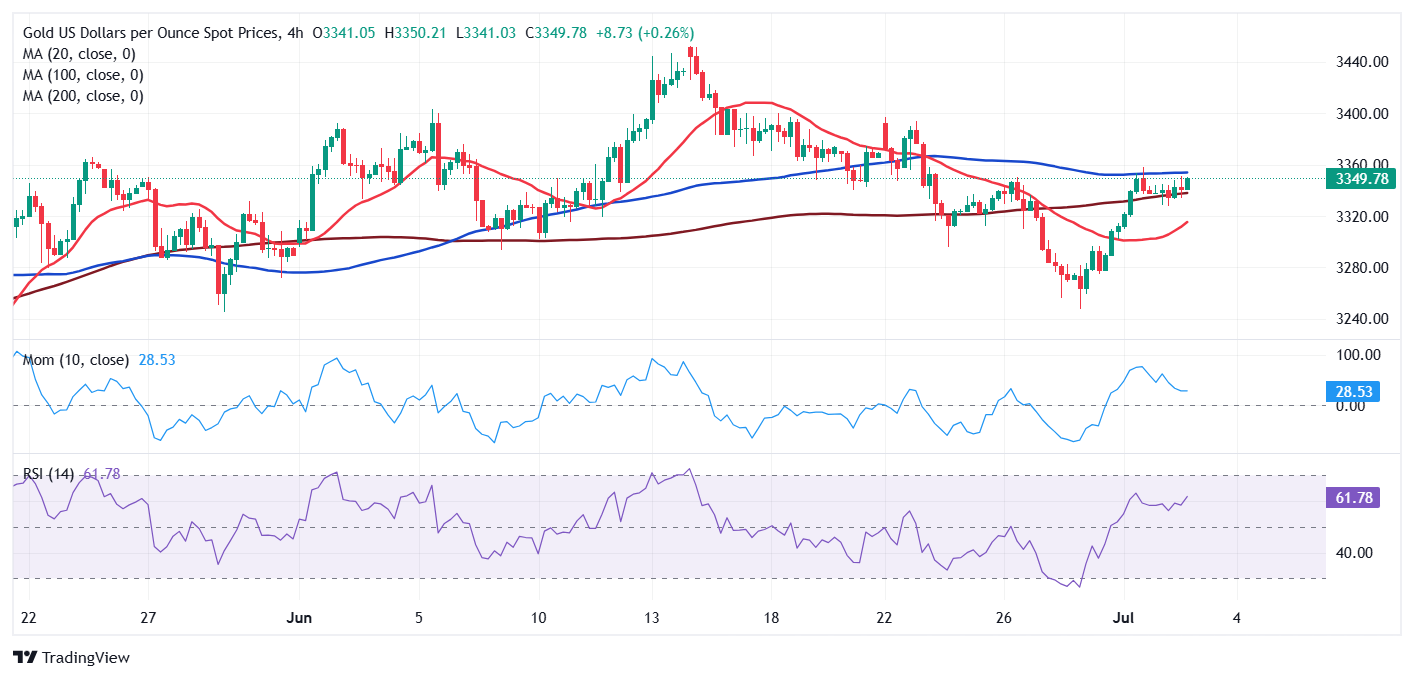
XAU/USD short-term technical outlook
From a technical point of view, the XAU/USD pair is poised to extend its advance, although additional confirmations are required. In the daily chart, the pair keeps struggling to overcome a flat 20 Simple Moving Average (SMA), which converges with the 50% Fibonacci retracement of the June slide at around $3,350. The 100 and 200 SMAs maintain their firmly bullish slopes far below the current level, while technical indicators lack directional strength within neutral levels, failing to provide clear directional clues.
The 4-hour chart, however, hints at higher highs, with the bright metal aiming to test the next Fibonacci resistance at $3,373.50. Technical indicators aim higher within positive levels after a consolidative phase, supporting another leg higher. Furthermore, the 20 SMA turned positive below the current level, while a mildly bullish 200 SMA provides intraday support.
Support levels: 3,325.00 3,311.90 3,295.45
Resistance levels: 3,350.00 3,373.50 3,389.40