
Quick overview
- Gold prices surged above $3,445 per ounce due to heightened geopolitical tensions in the Middle East, particularly between Israel and Iran.
- Recent easing of tensions and U.S. diplomatic efforts led to a significant drop in gold prices, breaking below key support levels.
- Gold has fallen nearly 7% in the last two weeks, with traders now eyeing the 100-day SMA around $3,150 as the next support level.
- The outlook remains cautious as geopolitical risks persist, but without new catalysts, further declines in gold prices may occur.
Live GOLD Chart
GOLD

Gold prices have been on a roller coaster ride above $3,100, driven by geopolitical fears but recently breached a critical support level as tensions eased.
Geopolitical Tensions Push Gold Into the Spotlight
Gold (XAU/USD) returned to center stage in recent weeks as investors sought safety amid intensifying Middle East tensions. The standoff between Israel and Iran, along with reports of possible U.S. airstrikes on Iranian facilities, led to a powerful surge in demand for the traditional safe-haven asset.
At its peak three weeks ago, gold prices shot up past $3,445 per ounce as traders priced in escalating risks and uncertainty. However, the sharp rally quickly lost momentum when the U.S. signaled limited direct involvement and international diplomatic channels swung into high gear to prevent a broader conflict. This shift in narrative reduced immediate fears of regional escalation and cooled demand for safe-haven positioning.
Recent Price Action: Breaking Support Levels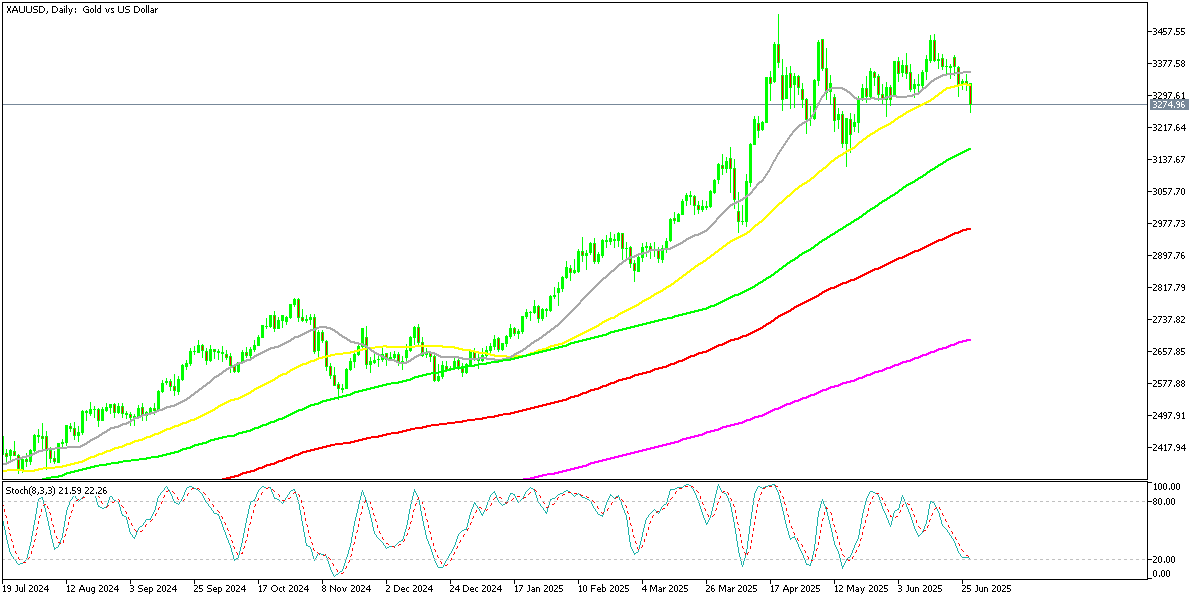
Despite an initial robust climb, gold prices have been on the back foot, falling nearly 7% over the last two weeks. This move comes even as global geopolitical risks remain elevated, underscoring that markets may have already priced in much of the fear premium.
Last week was particularly important from a technical standpoint. After briefly topping $3,500 per ounce in April 2025—a historic high—XAU/USD reversed hard, breaking below key chart levels. Notably, gold closed decisively below its 50-day simple moving average (SMA) on Friday, a support line that had reliably held for nearly a year.
This breach is a significant technical signal, suggesting a loss of upward momentum and opening the door to further declines. Traders are now eyeing the 100-day SMA around $3,150 as the next possible support, with a move below $3,000 no longer off the table if selling pressure persists.
Outlook: Balancing Risk and Support
While the easing of Israel-Iran tensions has removed some of the immediate safe-haven bid, geopolitical risk remains an undercurrent in markets. Any flare-up could see GOLD prices rebound sharply. However, without a fresh driver, the technical break below the 50-day SMA may encourage more selling, especially as some investors unwind crowded bullish positions.
In the near term, traders will be watching both the diplomatic developments in the Middle East and broader macro drivers such as U.S. interest rate expectations and dollar strength. The precious metal remains in focus as a hedge against both geopolitical and financial market shocks, but for now, the momentum has clearly shifted to the downside.
Gold Live Chart
GOLD
Skerdian Meta
Lead Analyst
Skerdian Meta Lead Analyst.
Skerdian is a professional Forex trader and a market analyst. He has been actively engaged in market analysis for the past 11 years. Before becoming our head analyst, Skerdian served as a trader and market analyst in Saxo Bank’s local branch, Aksioner. Skerdian specialized in experimenting with developing models and hands-on trading. Skerdian has a masters degree in finance and investment.