- Gold price remains supported above $3,300 ahead of the US CPI inflation test.
- The US Dollar cheers a positive outcome of the US-China London trade talks.
- The daily technical setup leans in favor of Gold buyers in the near term.
Gold price is gathering strength in Wednesday’s Asian trading, having defended the critical support near $3,300 so far this week. However, the further upside hinges on the US Consumer Price Index (CPI) data due later in the day.
Gold price eyes US inflation data amid US-China trade optimism
Following the second day of US-China trade talks in London on Tuesday, Bloomberg reported that both sides agreed on a framework for a trade deal that could potentially help resolve a trade war between the world’s two largest economies.
The US-China optimism helped the US Dollar (USD) recover some ground across its major currency rivals. However, the recovery lacks conviction amid the US Appeals court ruling that allows US President Donald Trump’s reciprocal tariffs to stay in place.
This uncertainty over Trump’s trade policies fails to lift risk sentiment, allowing the traditional safe-haven Gold price to gather upside traction.
Traders also remain wary ahead of the all-important US CPI data, which could alter markets’ expectations of a September Federal Reserve (Fed) interest rate cut.
Markets are currently pricing in about 52% odds of the Fed lowering rates by 25 basis points (bps) in September.
The US monthly CPI is forecast to increase by 0.2% and core inflation is expected to tick up to 0.3% in May. The data will likely show the first signs of Trump’s tariffs feeding through into prices.
Hotter-than-expected US monthly CPI reading could push back against markets’ expectations of a Fed rate cut in September, sending the US Dollar higher at the expense of the non-yielding Gold price
On the other hand, a surprise cooldown in the inflation data could reinforce the buying interest around non-yielding Gold price, as the data would reaffirm expectations of two rate cuts by the Fed this year.
However, the Gold price reaction to the US inflation report could be impacted by the trade headlines. Markets also keep a close eye on the US 10-year Treasury bond auction on Wednesday and Thursday.
Gold price technical analysis: Daily chart
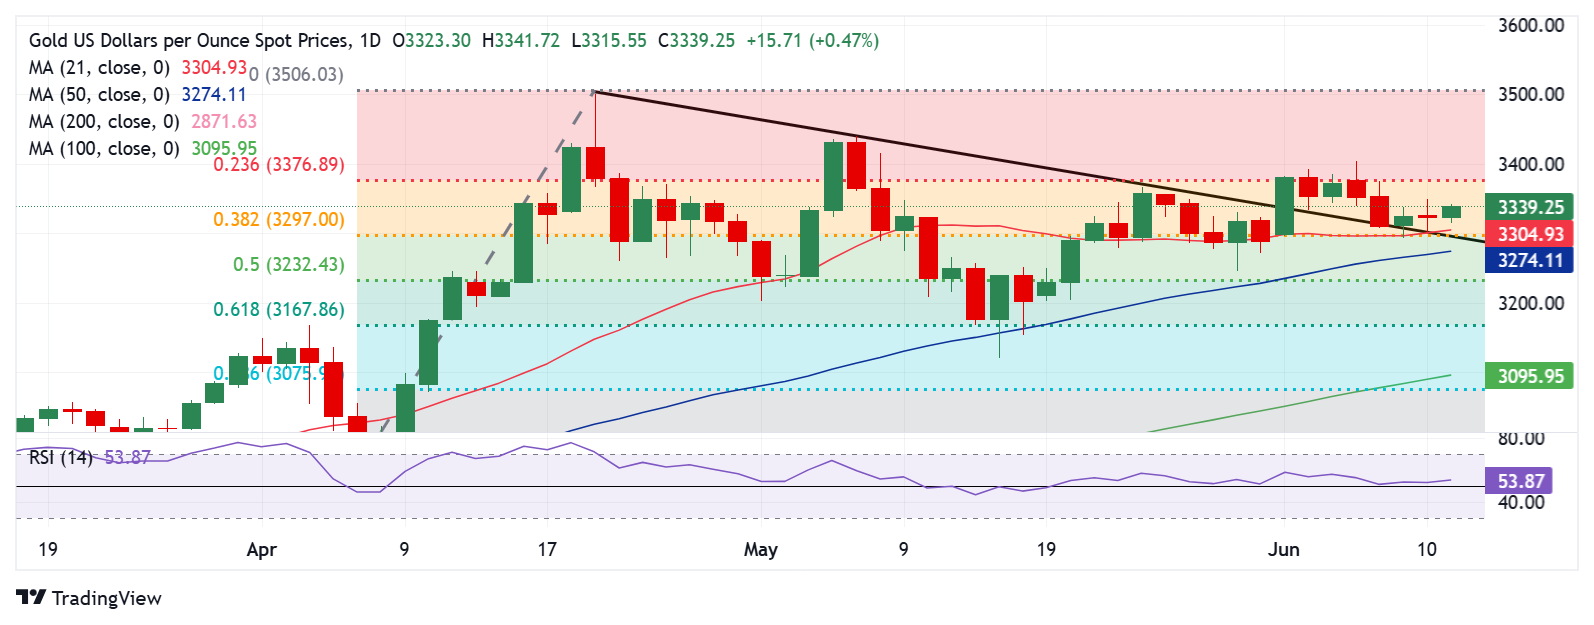
There are no changes to the short-term technical outlook so long as Gold price holds above the critical $3,297 level.
That level is the confluence of the 21-day Simple Moving Average (SMA) and the 38.2% Fibonacci Retracement (Fibo) level of the April record rally.
Further, the 14-day Relative Strength Index (RSI) has managed to hold its ground above the midline, currently near 54, supporting the bullish potential.
Gold sellers need a daily candlestick closing below the abovementioned strong support at $3,297 to challenge the 50-day SMA cap at $3,262.
The last line of defense for buyers is aligned at $3,232, the 50% Fibo level of the same ascent.
On the flip side, Gold buyers will likely find strong offers at the $3,350 psychological level if the rebound gathers strength.
The next resistance is spotted at the 23.6% Fibo resistance at $3,377, above which the May high of $3,439 could be threatened.
Economic Indicator
Consumer Price Index (MoM)
Inflationary or deflationary tendencies are measured by periodically summing the prices of a basket of representative goods and services and presenting the data as The Consumer Price Index (CPI). CPI data is compiled on a monthly basis and released by the US Department of Labor Statistics. The MoM figure compares the prices of goods in the reference month to the previous month.The CPI is a key indicator to measure inflation and changes in purchasing trends. Generally, a high reading is seen as bullish for the US Dollar (USD), while a low reading is seen as bearish.